Using the Pressure Zone Manager
The Pressure Zone Manager is a tool for identifying elements that are located in a pressure zone based on the boundaries of the zone. It also provides the ability to conduct flow balance calculations for any pressure zone, color code by pressure zone and export information on elements in a zone to the Zone Manager.
It is important to distinguish between the Pressure Zone Manager and the Zone Manager. The pressure zone manager identifies which elements are included within a pressure zone. It is specific to the current scenario and is not a permanent property of the elements. A Zone is a property that can be assigned to any element. It can be based on any criteria you desire. Assignment of an element to a Zone based on what Pressure Zone it is in can be performed by identifying a representative element within a pressure zone and assigning that zone to every node element in the pressure zone. Zones are further described here: Zones)
The Pressure Zone Manager identifies elements in a pressure zone, by starting at one element and tracing through the network until it reaches a boundary element which can include closed pipes, closed isolation valves, pumps or any control valve. You can determine which types of elements can serve as pressure zone boundaries. Once all elements within a pressure zone have been identified, the pressure zone manager moves to an element outside of the pressure zone and searches for elements within that pressure zone. This continues until all elements have been assigned to a zone or are serving as zone boundaries.
You may find that the pressure zone manager has identified more pressure zones than are in the system. This is due to the fact that the manager assigns all elements to a pressure zone so that there are pressure zones for example, between the plant clearwell and the high service pumps or between the reservoir node representing the groundwater aquifer and the well pump. These "pressure zones" only contain a small number of elements.
Starting pressure zone manager
Start the pressure zone manager by selecting Analysis > Pressure Zone or clicking the Pressure Zone Manager button. 
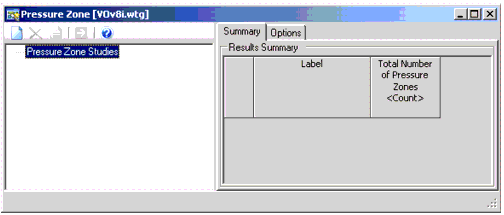
When the pressure zone manager opens, you will see a left pane which lists the scenarios for which pressure zone studies have been set up. The first time, it will be blank. In the right pane, You see the Summary tab which lists the scenarios for which the pressure zone manager has been run and the number of pressure zones which were identified in the run.
To begin a pressure zone study, select New from the top of the left pane, and then pick which scenario will be used for the study. You can perform pressure zone studies for any scenario.
Specifying Boundary Elements
Once the scenario has been selected, you can define which elements are to be used as pressure zone boundary elements using the Options tab in the right pane. The user choose from the following settings:
1. Always use
2. Use when closed
3. Do not use
4. (Pipes Only) Use when closed/Check valve
5. (Control Valves Only) Use When Active - When this is selected as the default status for a valve-type, elements of that valve-type will only be included as boundary nodes in the Pressure Zone tracing if their Status (Initial) field is set to "Active", and will be ignored otherwise.
6. (Control Valves Only) Use when Closed or Active - When this is selected as the default status for a valve-type, elements of that valve-type will only be included as boundary nodes in the Pressure Zone tracing if their Status (Initial) field is set to "Active" or "Closed", and will be ignored otherwise.

It is also possible to specify that an individual element behave differently from the default behaviors in the bottom right pane by clicking the Select from Drawing button at the top of the table and picking the element from the drawing.
Zone Scope
Once the settings have been established, select the scenario to be run in the left pane. Click the Zone Scope tab in the right pane.
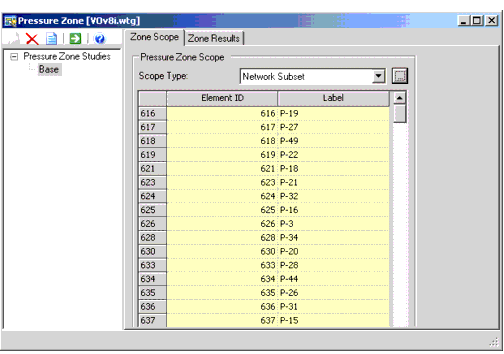
The first choice in the Zone Scope tab is whether to identify pressure zones for the entire network of a subset of the network. The default value is "Entire network".

If you want to run the pressure zone manager for a portion of the system, you should select Network Subset from the drop down menu and then click on the box to the right of the drop down arrow. This opens the drawing where you can make a selection using the standard selection tools as shown below. The fourth button enables you to select by drawing a polygon around the elements while the fifth button enables you to choose a previously created selection set. Remember to Right click "Done" when finished drawing the polygon.

Upon picking the green check mark, the Zone Scope dialog opens again, displaying the elements selected.
Associating Pressure Zones with the "Zone" property
You can now run the pressure zone identification part of the pressure zone manager. However, if you want to associate pressure zones identified with Zones in the Zone Manager, the bottom of the right pane is the place to make that association. Each Zone is associated with a Representative Element - that is, an element that you are certain will be in the pressure zone associated with the Zone. For example, if Tank A is in the "Tank A Zone", then Tank A is a logical choice for the representative element. If a zone is to be named after the PRV feeding the zone, it is best to relabel the node on the downstream side of the PRV as something like "PRV Z Outlet" and choose that as the representative element. You can access the Zone Manager by selecting the button at the top of the lower right pane. All of the Zones in the Zone Manager are listed in the column labeled Zone but you do not need to identify a representative element in each. It is best to set up Zones before starting the pressure zone manager. In that way, the drop down list under Representative Element on the Zone Scope tab (see below) will be populated.

Running Pressure Zone Manager
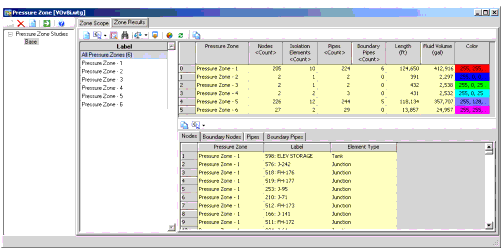
To identify pressure zones, select the Compute button (4th button on top of the left pane). The pressure zone manager runs and prepares statistics on each pressure zone as shown below.
Overall Results
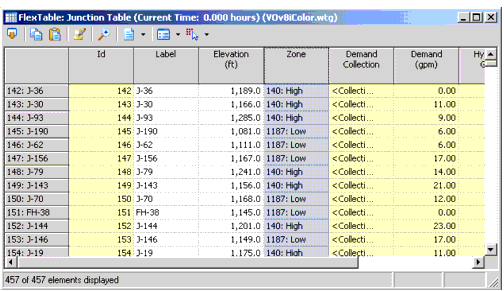
For each pressure zone, the number of nodes, the number of boundary (isolation) elements, the number of pipes, the length of pipe in the zone, the number of customer meters, the volume of water in the zone and the color associated with the zone in the drawing are displayed in the top right pane.
The lower portion of the right pane provides information on the individual elements in each pressure zone indicating the pipes, nodes, and customer meters in each zone and the pipes and nodes that serve as boundaries each in their own tab. You can also create selection sets corresponding to elements in each pressure zone by picking a pressure zone in the center pane (called Label), and then clicking the Create a Selection Set button on top of the lower right pane.
Click the Select In Drawing button to open a submenu allowing you to select any number of highlighted rows in the drawing, add to the selection, or remove from the existing selection.
Click the Zoom To button to center the drawing view on the highlighted element.
Exporting Pressure Zones to Zones
At this point, the pressure zones are labeled Pressure Zone - x, where x is a number indicating the order in which the pressure zone was identified. These pressure zones can be associated with the Zones using the fifth button, Export Pressure Zone. This opens up the Export dialog which lists the Zones that will be associated with the pressure zones based on representative elements.
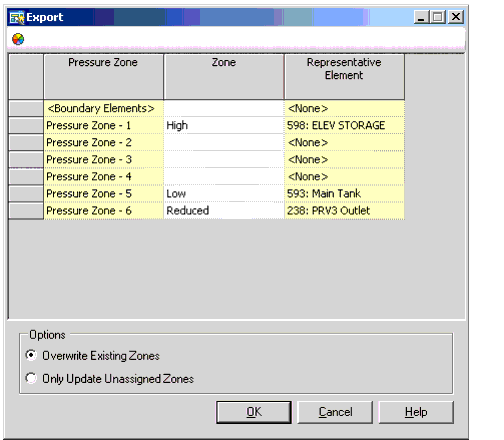
The options at the bottom of the dialog control whether the Zone assignments that will be made will overwrite existing Zone assignments.
After selecting OK, each element in a pressure zone that has a representative element is assigned the Zone name associated with that representative element.
For more information, see Pressure Zone Export Dialog Box
Pressure Zone Flow Balance
The fourth button performs a flow balance on each pressure zone. For each Pressure Zone, it displays the Zone (if one is associated with the pressure zone), net inflow (flow across the boundaries but not including flow originating from tanks and reservoirs in the pressure zone), the demand in that zone, the minimum and maximum elevations in the pressure zone, the minimum and maximum hydraulic grade lines in the pressure zone, and the minimum and maximum pressure in the pressure zone. If the scenario is not steady state, then the results correspond to the current time step. The lower pane displays the flow through each boundary element. If the hydraulics have not been calculated for this system, a message is given that the model needs to be calculated.

For more information, see Pressure Zone Flow Balance Tool Dialog Box.
Color Coding by Pressure Zone
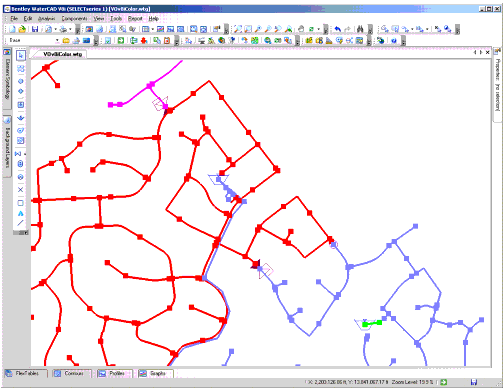
The sixth button color codes the drawing by pressure zone. Each zone is colored according to the color displayed in the rightmost column of the table. In the image below, the main zone is blue, the red zone is boosted through a pump, the magenta zone is a reduced zone fed through a PRV and the green zone is a well.
Other Pressure Zone Results
Other buttons such as Report, Refresh, Export to Selection Set, Zoom to and Copy behave as they do for other WaterGEMS CONNECT features.
The results of a pressure zone analysis as stored in a .pzs file.